Scientists tell us that the earth is warming at the rate of 0.20C per decade because we emit too much CO2. Some people are sceptical while others wonder how one can be so precise about an object whose temperature varies from -500C to +500C in place and time. How far can we trust the scientists?
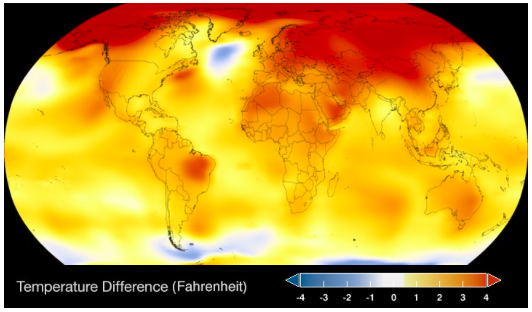
The temperature in 2017 compared to the average from 1951 to 1980 according to NASA (https://climate.nasa.gov/vital-signs/global-temperature/)
There are three steps in the argument: the measurement of temperature, the interpretation of the temperature trends, and their cause. This article will focus on the first two.
To measure the temperature on the earth’s surface, data is assembled from nearly five thousand stations on land, and from buoys and ships at sea. The key point is that the temperature itself is not important, it is the change of temperature at each station that counts. This change is the difference with respect to the average temperature recorded at that station for an arbitrary 30-year period. The difference is often called the anomaly.
The earth’s surface is then divided into areas of 5 degrees in latitude and longitude and the station anomalies within each area averaged if necessary. The results for each area are then averaged globally taking into account the size of each area and other factors. Some of these results are shown above and below.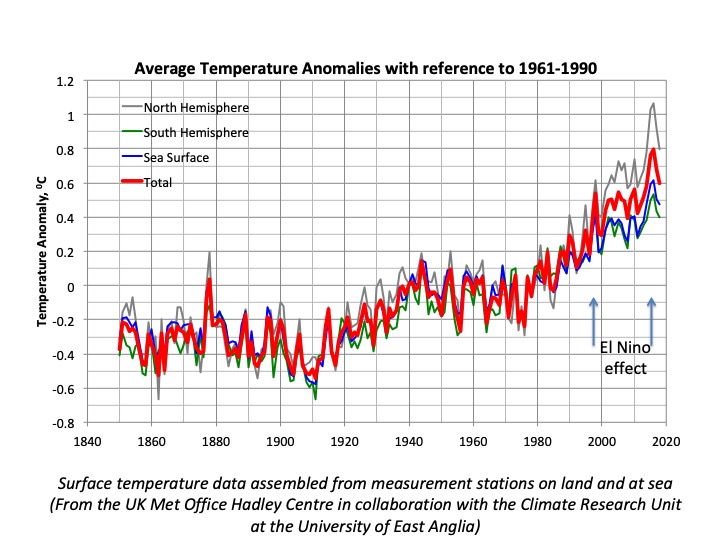
To be accurate the station must sample and record the temperature under the same conditions every year. This is almost impossible for a station that has been used for any length of time. Not only might the instrument age or be replaced but the environment might change: the area around a station might once have been open fields which have since been urbanised. At sea, water samples were originally gathered in wooden buckets, then in canvas buckets, and finally from the input of the engine room cooling water. All these changes and many more need to be characterised and corrected for, and the corresponding uncertainty calculated.
With so many adjustments needed one might doubt the accuracy of the final result, but the most convincing argument is that in very different conditions of measurement, such as sea versus land, or completely different areas, such as northern versus southern hemisphere, the trends are very similar. In addition different agencies obtain nearly the same result. This consistency is a powerful argument for validity.
Furthermore there is abundant data on the temperature of the earth’s atmosphere, in particular the layer just above the earth’s surface (the troposphere). For many years this has been measured by radiosondes, which are balloon-borne instruments that transmit data to ground-based receivers. Some 1300 such radiosondes are launched from sites around the world at the same time each day to provide weather and climate information.
Since 1979 this information has been augmented by satellite data. The satellite measures the radiation received from the earth at different frequencies in the microwave range. Among other things this depends on the amount of radiation absorbed and re-emitted by different gases at different heights and temperatures.
Sorting all this out requires complicated models but, as with surface measurements, it is not the absolute temperature that concerns us here but the change over large areas and long times. For this the satellite data is well suited. As can be seen in the plot below the agreement with surface measurements is remarkably good.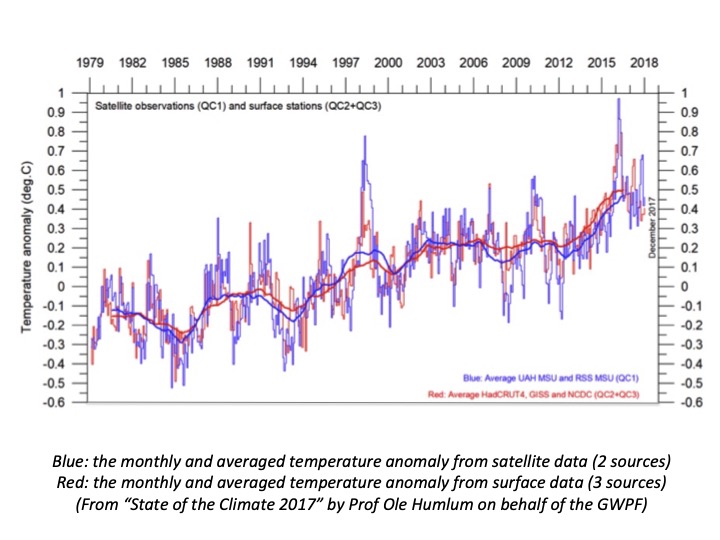
With this evidence it is not surprising that most climate sceptics do not nowadays dispute the overall temperature data. Instead they disagree about how to interpret it and, of course, the cause. Climate is the long-term aspect of the weather and has traditionally been averaged over 30 years. Thus the temperature rise since 1980 is barely more than one climate period and, it could be argued, too short to confirm a trend. There are also periods since industrialisation started, such as from 1940 to 1975, in which the temperature dropped.
For example the Global Warming Policy Foundation argues that if you ignore the temperature peak in 2015/16 – which everyone agrees is due to a strong El Nino event in which deep ocean heat is transferred to the atmosphere – then temperatures since 2002 have been flat and may continue to be so. The counter argument is some flat periods are normal and that in 2017 and 2018 the temperature continued to be high. Also, if you remove El Nino events from the record you should remove La Nina events, which have the opposite effect.
In conclusion there is sufficient agreement in data from different sources for us to believe the scientists when they say that the average temperature is rising, and that is before considering indirect evidence such as the retreat of mountain glaciers and the change in sea level. The cause is another matter.


